博主
258
258
258
258
专辑
- 跟着禹神学Vue3 1
- Vue3+Element Plus 12
- hutool工具包的使用 13
- 学习笔记zg4 23
- javaweb专辑 2
- gradle专辑 1
- 学习笔记zg2 25
- LeetCode学习 1
- Redisson分布式锁架构 4
- 学习笔记zg6 4
- java面试问题扩充 1
- 消息中间件学习 3
- 学习笔记20230815 11
- Vue3编程专辑 3
- 图片 1
- JVM诊断调优工具Arthas 教程到实战 8
- AOP专辑 3
- ChatGPT问答专辑 4
- kafka 1
- HBase数据库专辑 6
- 第三方接口访问方法 5
- 课堂笔记 1
- 分布式文件存储系统MinIO 5
- Linux运维与安全 4
- Kubernetes专辑 2
- 11 1
- VMWare使用专辑 3
- 线程池 1
- Spring面试 1
- Mycat 2
- Spring 自定义注解与Aop 2
- FFmpeg 1
- ElasticSearch 1
- 面试八股文 5
- mysql 1
- Mybatis 1
- docker 1
- vscode开发vue程序的环境配置 3
- DFA 算法实现的高性能 java 敏感词工具框架sensitive-word 3
- 随心笔记 4
- kafka入门专辑 7
- Websocket专辑 2
- Sentinel专辑 7
- 支付宝支付专辑 3
- Java错误集锦 5
- Web Uploader大文件上传专辑 4
- Mybatis 与 MybatisPlus 专辑 4
- oracle 1
- 达梦数据库 1
- 若依框架专辑 4
- FreeMarker专辑 6
- 电商专辑 1
- 专辑 2
- JAVA十八罗汉 1
- SQL优化专题 6
- MyCat专辑 2
- 简单思考 1
- 学习文档 22
- 腾讯云直播专辑 9
- Skywalking链路追踪 3
- Java面试问题专辑 12
- Java常用工具类专辑 10
- java基础技术及功能 2
- PDF专辑 2
- 网站接入第三方微信扫码登录 3
- Seata分布式事务专辑 2
- Activiti工作流专辑 2
- Linux 1
- Mybatis和MybatisPlus杂记 1
- JMeter专辑 2
- 阿里直播专辑 1
- 面试专辑-数据库篇 1
- 微信登录专辑 1
- MySQL编程指南 3
- Jsoup专辑 6
- MySQL专辑 1
- Apache AB入门 3
- Spring事务专辑 3
- 数据库 1
- 算法 2
- Thymeleaf模版专辑 13
- Java数据加密专辑 4
- Spring框架入门教程 2
- maven专题 6
- JVM专题 9
- 面试专辑高级篇 15
- 面试专辑基础篇 15
- SpringBoot集成Excel的导入导出功能 2
- java设计模式 2
- Apache ECharts使用入门 9
- 分布式框架之zookeeper+dubbo 8
- Java面试专辑 2
- Excel 3
- 微信支付入门 18
- SpringCloud-Alibaba入门专辑 14
- Linux服务器环境配置专辑 8
- SpringCloud-Alibaba 3
- redis葵花宝典 4
- nginx服务器系列 9
- FastDFS专辑 4
- 参码电商平台系统 3
- RabbitMQ由入门到精通 11
- mybatis -plus 7
- IDEA使用技能专辑 10
- MongoDB专辑 6
- Elasticsearch专辑 20
- SSM框架 5
- Redis编程指南 1
- Linux系统常用命令的使用 0
- SpringSecurity安全框架 7
- SpringBoot集成Redis编程 4
- Redis入门专辑 28
- Vue编程专辑 39
- 文件上传到阿里云OSS实战 4
- git源码管理专题 12
- HTTP协议简析 4
- Docker环境搭建专辑 32
- SpringBoot微服务编程专辑 51
- SpringCloud微服务架构 20
- svn源码管理专题 0
- Oracle编程指南 0
- Json编程指南 0
- Spring 实战 0
- 华为高斯(GaussDB)数据库专辑 0
- SpringBoot中的Thymeleaf模板入门 0
- 搭建Window的开发环境 0
- Java语言开发笔记 0
- 微信登录接口专辑 0
第九节 Vue集成echarts
亮子
2022-02-28 08:44:43
6251
0
0
0
1、安装插件
npm install echarts --save
2、创建图表容器
<template>
    <div>
        <div>
            <div id="main1" style="width: 400px;height: 300px;"></div>
        </div>
    </div>
</template>
3、集成echarts
    import * as echarts from 'echarts';

	// 基于准备好的dom,初始化echarts实例
	let myChart = echarts.init(document.getElementById('main1'));
	this.echart1 = myChart
	// 准备数据
	let option = {
	  title: {
		text: 'ECharts 入门示例'
	  },
	  tooltip: {},
	  xAxis: {
		data: ['衬衫', '羊毛衫', '雪纺衫', '裤子', '高跟鞋', '袜子']
	  },
	  yAxis: {},
	  series: [
		{
		  name: '销量',
		  type: 'bar',
		  data: [5, 20, 36, 10, 10, 20]
		}
	  ]
	}
	// 绘制图表
	myChart.setOption(option);
4、显示效果
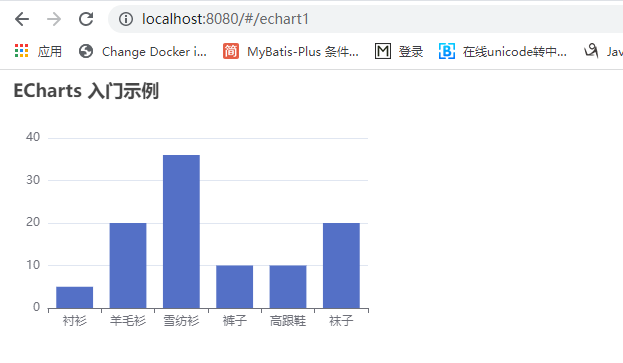
5、完整代码
<template>
    <div>
        <div>
            <div id="main1" style="width: 400px;height: 300px;"></div>
        </div>
    </div>
</template>

<script>
    import * as echarts from 'echarts';
    export default {
        name: 'Echart1',
        data() {
            return {
                echart1: null,
            }
        },
        mounted() {
            // 基于准备好的dom,初始化echarts实例
            let myChart = echarts.init(document.getElementById('main1'));
            this.echart1 = myChart
            // 准备数据
            let option = {
              title: {
                text: 'ECharts 入门示例'
              },
              tooltip: {},
              xAxis: {
                data: ['衬衫', '羊毛衫', '雪纺衫', '裤子', '高跟鞋', '袜子']
              },
              yAxis: {},
              series: [
                {
                  name: '销量',
                  type: 'bar',
                  data: [5, 20, 36, 10, 10, 20]
                }
              ]
            }
            // 绘制图表
            myChart.setOption(option);
        },
        methods: {

        }
    }
</script>

<style>
</style>